Are body fat scales accurate?
DEXA vs. smart scale
The levels disagree. The change largely does not. Illustrative figures. That pattern is the reason to run both.
IN SUMMARY
How accurate are body fat scales? On absolute values, not very: against a four-compartment reference, fifteen bioelectrical impedance devices, fourteen of them consumer-grade, showed group biases from 3.5 points under to 11.7 points over the true body-fat percentage. And RENPHO's own blog concedes a 3–5% margin against methods like DEXA.
On change, the story reverses: in the same study, nine of the fifteen devices tracked twelve-to-sixteen-week shifts in body composition statistically as well as the reference did, because a scale's error is mostly a stable bias that subtracts out. A DEXA scan is the instrument most consumer scales are checked against, and is itself checked against the four-compartment reference: its same-day test-retest error runs under one percent.
One distinction first, because it decides everything below. A plain bathroom scale reports a single number: your total weight. A body-composition scale, the smart scale this page is about, adds a small electrical current and estimates fat mass and lean mass from it. Only the second kind is in this comparison.
The practical answer: use that scale for direction, under consistent morning conditions; use a scan for the level, every few months; and never compare a reading from one device to a reading from another.
Stop choosing. Run both: each answers what the other can't.
- 01
The scan settles the level
DEXA is the method most scales are checked against. Its absolute values and regional breakdown are what you quote and what you plan from.
- 02
The scale settles the direction
A daily impedance reading is far better at showing which way fat and lean mass are moving than at telling you exactly where they are.
- 03
Bild Health shows you the gap
How far your daily line sat from the scan on the day it landed: the one diagnostic that owning both instruments actually buys you.
- 04
One chart, nothing blended
Estimates stay visually distinct from measurements. We never average a scan into a scale reading to produce a number that is neither.
- 05
Read the line, not the day
Fat and lean charted over weeks with DEXA checkpoints on the same axis, because a single day's impedance number is hydration in costume.
- 06
Claims from the literature, not the box
What we say these instruments can do comes from the methods literature. Nothing here rests on a percentage printed on packaging.
Body fat scale accuracy, in three numbers
Each from the methods literature; none from a box.
Fifteen BIA devices, fourteen of them consumer-grade, vs a four-compartment reference: group biases from −3.5 to +11.7 percentage points. The 3–5 points vendors themselves concede is the floor of the range, not the range.
Over 12–16 weeks, most tested scales measured the shift in body composition statistically as well as the four-compartment model: the error is mostly a stable bias, and a bias cancels in a difference. The cohort's average change was small, so this is evidence a scale holds a trend without drifting, not that it captures a large swing.
Two consecutive total-body scans with repositioning: coefficients of variation of 0.82% for fat mass and 0.5% for lean tissue. Precision at a level no consumer instrument approaches; day-to-day comparisons carry more error.
How Bild Health holds two instruments at once
Four design decisions that follow directly from the comparison above.
Two sources, one chart, no blending
Daily scale readings and periodic scans share the same fat-mass and lean-mass chart, and are never averaged into one figure. Blending a measurement with an estimate produces a number that is neither, and throws away the thing you paid the scan for.
- Scale readings arrive through Apple Health and Health Connect, and form the continuous line
- Scans render as distinct checkpoint markers
- Nothing is silently reconciled between the two
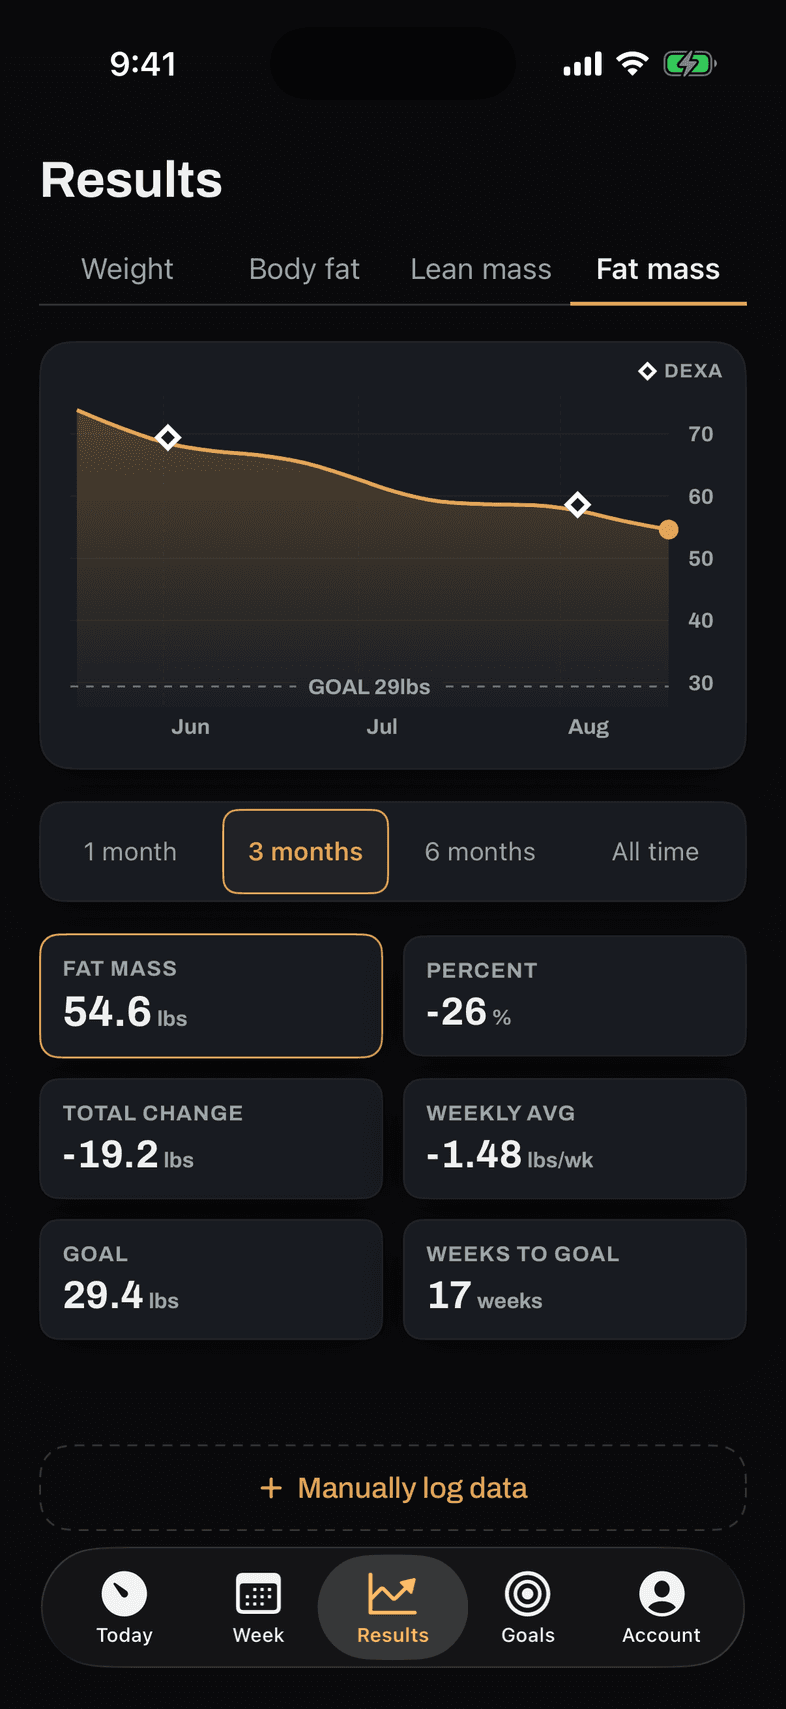
See how far your scale is off
When a scan lands, the distance between it and where the daily trend sat is right there. That gap is the payoff of owning both instruments: it tells you roughly how your scale is biased, and therefore how to read every reading it gives you until the next scan.
- Scan markers sit on the trend, so the offset is visible at each checkpoint
- Consistent offsets easy to spot across several scans
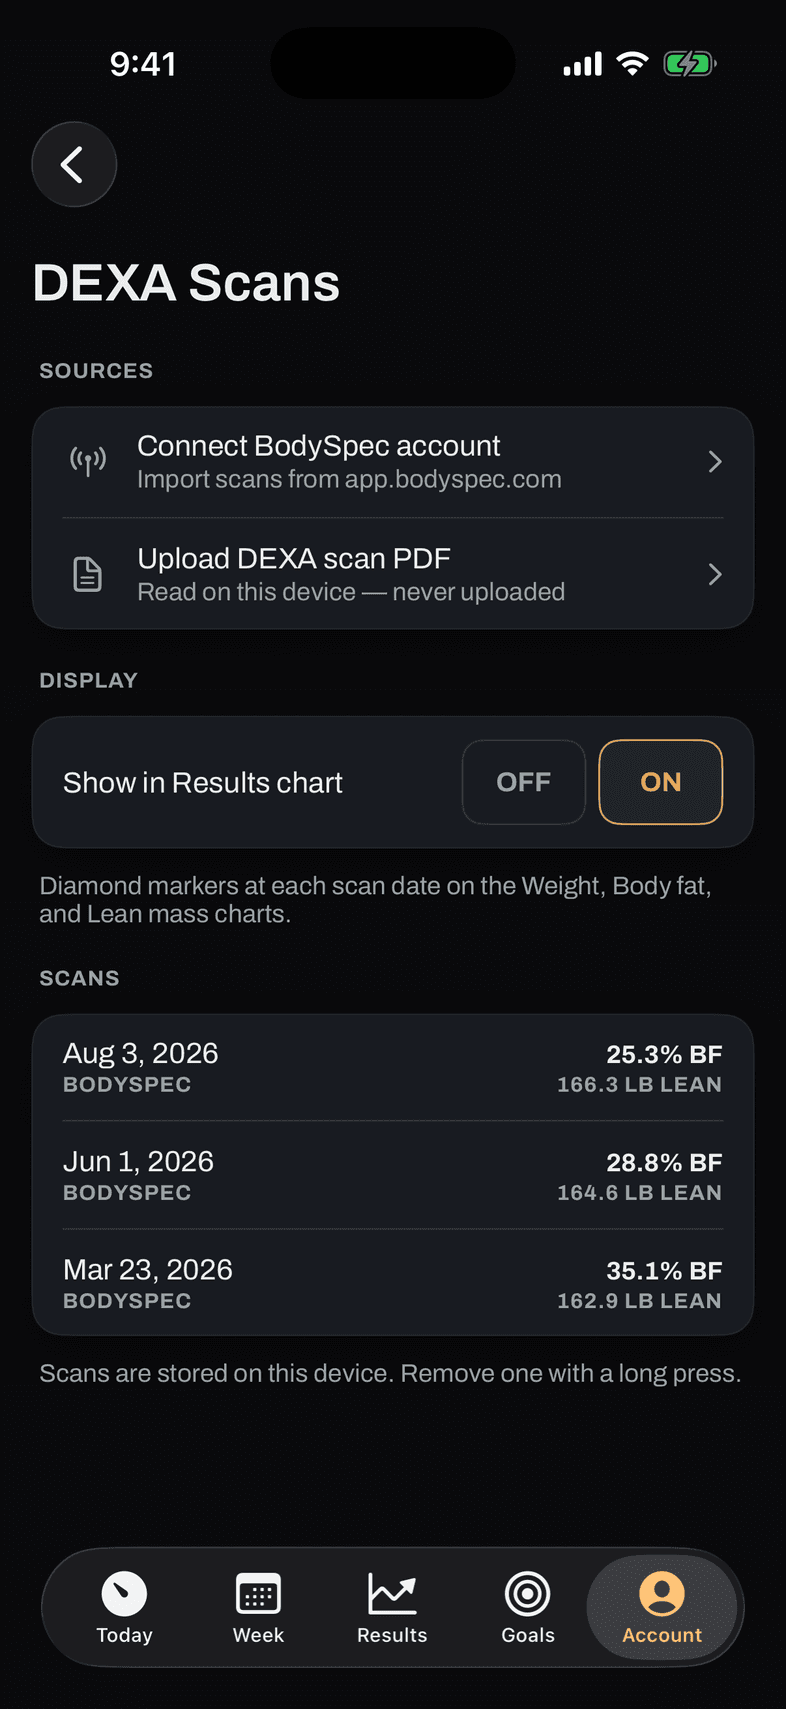
Built to be read over weeks
Fat mass and lean mass run as separate series with a weekly-average tile beside the current value, and scan checkpoints hold the line honest. The shape over weeks is the number you can act on, which is exactly what an impedance reading can support.
- Fat and lean as separate series, per-week rates alongside
- The line is your latest reading each day: read it over weeks, not days
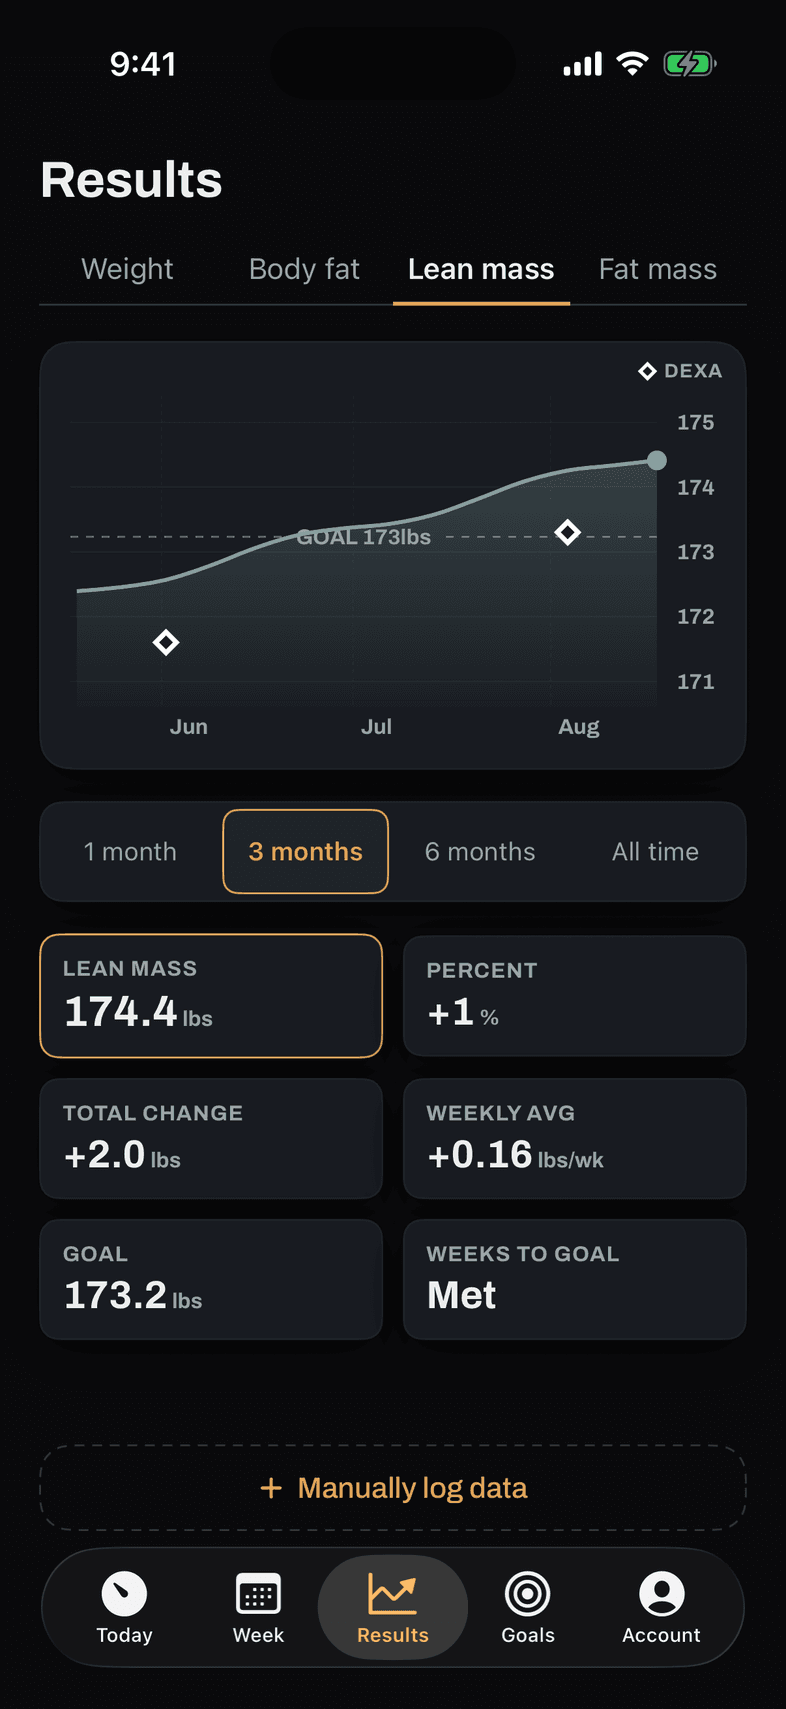
Accuracy, precision, and why the cheaper instrument is still worth owning
Most arguments about body-composition devices go wrong in the first sentence, because they use one word for two properties. Accuracy is how close a measurement sits to the true value. Precision is how closely repeated measurements agree with each other. A bathroom scale that reads four pounds light every single time is precise and wrong.
Separate the two and the comparison stops being a contest. DEXA is the accurate instrument you use rarely; the scale is the approximate one you use every day. And if the scale's error is largely a stable bias (the same offset in the same direction each time), subtracting one reading from another cancels most of it. The change it reports is worth far more than the value it reports. That is the whole case for owning a device you have just been told is inaccurate, and it is the principle Bild Health's trend view is built on.
What each instrument physically does
DEXA passes two X-ray energies through the body and works backwards from their differential absorption to how much bone, fat, and lean soft tissue lay in the path. A body-composition scale runs bioelectrical impedance analysis: it sends a small alternating current between electrodes in its surface, measures the body's resistance to it, and feeds that resistance into a regression equation (one fitted against reference measurements in a sample population) to estimate total body water and, from it, fat-free mass. Fat mass is what follows, by subtraction from body weight. Every term in that sentence is defined, one per entry, on Definitions. Where each instrument sits between a bathroom scale and a D3-creatine count, and why each rung replaces an inference with a measurement, is the instrument ladder on The Science.
Two things follow. The scale's answer depends on how closely you resemble the population its equation was fitted on, which nobody discloses and you cannot check. And because the signal is electrical and body water conducts, anything that shifts your fluid balance shifts the estimate: hydration, a recent workout, a salty meal, alcohol, time of day. This is measurable: in a controlled test, drinking two litres of water pushed impedance body-fat readouts up by roughly one to two percentage points within an hour. Hydration alone moves the number by more than a week of real change.
| Property | DEXA scan | Body-composition smart scale |
|---|---|---|
| What it measures | Differential absorption of two X-ray energies | Electrical resistance to a small alternating current |
| How the result is produced | Attenuation resolved into bone, fat, and lean soft tissue | Resistance fed into a regression equation fitted on a reference population |
| Regional detail | Yes: arms, legs, trunk reported separately | Whole-body on most units; some segmental models estimate by limb |
| Main sources of error | Positioning, machine and software differences between facilities, scanner precision error | Hydration, time of day, recent food or exercise, mismatch between you and the equation's population |
| Repeatability | High, when conditions and equipment are held constant | Often high, which is easy to mistake for accuracy |
| Realistic cadence | A handful of points a year | Every morning, at no marginal cost |
| Ionising radiation | Yes: a small dose per scan | None |
| Cost per reading | A per-scan fee, plus getting to the facility | Effectively zero after purchase |
| Best at | Absolute values and the regional breakdown | Direction and rate of change over time |
| Worst at | Telling you what happened this week | Telling you what your body fat percentage actually is |
Impedance estimates move with your fluid balance; DEXA values move with the machine. Hold each constant and the comparison holds.
Which reading answers which question
All of it comes down to routing. Given a thing you want to know, which instrument do you look at, and which one do you ignore?
| What you want to know | Read this | Why |
|---|---|---|
| Is my fat mass falling this month? | The scale trend | A stable bias cancels in a difference; the direction survives the error |
| What is my body fat percentage? | The most recent scan | This is an absolute value, and absolute values are where the estimate is weakest |
| Did my legs lose lean tissue? | The scan's regional breakdown | Most consumer scales have no regional output at all |
| Was this week's drop real or water? | The scale trend, over more days | Fluid swings dominate short windows; only a longer window separates signal from noise |
| Is the lean-mass line holding through this dose step? | The scale trend, checked at the next scan | The scale shows the shape; the scan confirms the level |
| Has anything changed since my last scan? | Both, in that order | Read the trend for the story, then the scan delta for the magnitude |
Getting a reliable trend out of an unreliable number
If the scale's absolute value is off but its bias is stable, everything depends on keeping the conditions stable too, because every condition you let vary gets read as body composition. The protocol that makes the trend trustworthy costs nothing:
- Same time every day: first thing in the morning, after the bathroom, before food, coffee, or water.
- Same state: not right after training, a sauna, alcohol, or an unusually salty evening; each one moves fluid, and fluid moves the reading.
- Same device, bare feet, same spot on a hard floor. Comparing across devices measures the devices, not you.
- Read the line, never the day. A single reading is hydration wearing a body-fat costume; two weeks of readings is a signal.
Held to that, the change-tracking result above is on your side: most tested devices measured twelve-week shifts about as well as the reference method. Let the conditions drift and you are charting your fluid balance with great confidence.
Are RENPHO and Withings scales accurate? Reading the vendors' own numbers
The two brands people actually search for make instructively different claims. RENPHO publishes no accuracy percentage at all, and its own blog concedes that body-fat scales “often have a margin of error of 3-5% compared to more sophisticated methods like DEXA scans or hydrostatic weighing.” Take the admission at face value, and note the peer-reviewed band above runs wider.
Withings advertises “99% reliability” for its Body Scan against DEXA. The figure is real but it is a correlation (r=0.99, from an unpublished internal study of 80 people). And correlation is not agreement. A scale that reads five points high on everyone still correlates almost perfectly with the truth, because correlation measures whether two numbers move together, not whether they match. In a hospital study that measured agreement directly, three consumer scales, a Withings model among them, showed median fat-mass errors of two to four kilograms low against DEXA, while nailing body weight to within a few hundred grams. Weight is measured; composition is estimated. The box quotes the property that flatters the estimate.
Why this matters more on a GLP-1
In pooled DEXA and MRI trials, roughly 25–39% of the weight lost on these medications was lean mass rather than fat. And in arms that added a structured resistance-training programme, the share was far lower. A sustained appetite-driven energy deficit is the whole point of these medications, which makes the fat-versus-lean split worth watching continuously rather than twice a year. And the split is exactly what no single instrument delivers alone. The accurate one is too infrequent to draw a trend; the frequent one is too approximate to trust in absolutes. The lean number also sizes the protein target: a free calculator runs that rule.
So the answer to “DEXA or smart scale” is both, on one chart, which is the chart Bild Health draws. For the hardware decision, our smart scale buyer's guide covers four picks at four budgets, and our guide to keeping muscle on a GLP-1 covers what to do with the numbers once you have them.
The instruments disagree. Most apps make you pick one.
A scan and a scale will return different numbers for the same body on the same day. That is not a malfunction: it is two methods with different error profiles, and an app that hides it is throwing away information.
- One number, whichever device produced it
- A body fat percentage with no indication of its provenance
- Scans, if at all, as an unrelated note
- No way to tell an estimate from a measurement
- The daily estimate as a trend line
- Each scan as a checkpoint on that same line
- The gap between estimate and scan, visible at every checkpoint
- Change over an interval as the headline, not a spot value
Where these numbers come from
- 01
British Journal of Nutrition · 2023 · Siedler MR et al. Br J Nutr. 2023;130(5):827–840. Full text: https://pmc.ncbi.nlm.nih.gov/articles/PMC10404482/
- 02
European Journal of Clinical Nutrition · 2011 · Hind K, Oldroyd B, Truscott JG. Eur J Clin Nutr. 2011;65:140–142. PMID 20842171.
- 03
Accuracy of Smart Scales on Weight and Body Composition: Observational Study
JMIR mHealth and uHealth · 2021 · Frija-Masson J et al. JMIR Mhealth Uhealth. 2021;9(4):e22487. Full text: https://pmc.ncbi.nlm.nih.gov/articles/PMC8122302/
- 04
Libyan Journal of Medicine · 2020 · Ugras S. Libyan J Med. 2020;15(1):1741904. N=140 healthy adults, foot-to-foot BIA.
- 05
Body Scan vs. DEXA scan: Withings' connected scale shows 99% reliability
Withings (vendor blog) · 2026 · Internal Withings/Mon Stade study, N=80, Body Scan only. Archive copy (site bot-blocks): via web.archive.org for the same URL.
- 06
How Accurate Are Body Fat Scales? Pros and Cons to Consider
RENPHO (vendor blog) · 2024 · Published 2024-07-11, revised 2025-04-22.
- 07
Diabetes, Obesity and Metabolism · 2026 · Eisa N, Barood O. Diabetes Obes Metab. 2026;28(6):4818–4827. doi:10.1111/dom.70666. PMID 41877354.
DEXA vs. smart scale, answered
How accurate are body fat scales?
On absolute body-fat percentage: off by three to five points or more. A fifteen-device study against a reference method found biases from −3.5 to +11.7 points. On change over weeks, most devices track nearly as well as the reference, because the error is a stable bias that cancels in a difference.
Is a DEXA scan more accurate than a smart scale?
Yes, structurally: DEXA is the method most smart scales are checked against, with same-day repeat error under one percent. A consumer scale estimates from an electrical signal and a population equation. They are not the same tier of instrument, and pretending otherwise helps no one.
Why does my smart scale disagree with my DEXA scan?
The scale never measured your composition: it measured electrical resistance and fed it into an equation fitted on a reference population. Differ from that population in build, age, or hydration and the estimate carries a bias. The bias is usually consistent, which is why the disagreement is similar each time.
Are RENPHO scales accurate?
RENPHO publishes no accuracy figure; its own blog concedes a 3–5% margin of error against methods like DEXA. That makes a RENPHO fine for what impedance scales are genuinely good at (the direction of change under consistent morning conditions) and unreliable for your true body-fat percentage.
Does hydration affect body fat readings?
Substantially: the measurement is electrical and water conducts. In a controlled test, drinking two litres moved impedance body-fat readouts by one to two percentage points within the hour. Training, salty meals, and time of day all shift it, which is why consistent conditions matter more than the device.
Which should I use to track GLP-1 weight loss?
Both, at their own cadence and level of trust. The daily scale line shows whether fat is falling while lean holds; the periodic scan shows how far that line drifted and adds the regional breakdown no scale produces. Bild Health charts both on one line, scans marked as checkpoints against the daily trend.
Related pages
- How to Keep MuscleOzempic Muscle Loss: How to Keep Muscle on a GLP-1
- For MenGLP-1 Muscle Loss in Men: Keeping Muscle After 40
- For WomenGLP-1 Muscle Loss in Women: Menopause, Muscle and Bone
- Body Fat CalculatorBody Fat Calculator: A Healthy Target by Age
- The ScienceThe Science Behind Bild Health: Muscle, Fat, and GLP-1s
- DefinitionsBody Composition Terms, Defined: Lean Mass, FFM, DEXA
Use the accurate one rarely. Use the frequent one properly.
Bild Health charts the daily estimate and the periodic scan on one line, so you can see how far apart they are and read each accordingly.
Lose the fat. Keep the muscle.